You have 1 article left to read this month before you need to register a free LeadDev.com account.
Presenting to the board can be an intimidating experience.
It’s often the case that I see the executive teams prepare their board presentations in silos. Each leader puts together some slides and presents to the board their narrative. Like a golf group (as described in The Advantage by Patrick Lencioni), each player tallies their score and presents how well (or maybe not so well) they played.
This is the most common method, but I prefer a different way: the collective narrative. Like a basketball team, the executive team presents as one unit, they focus on what they want to achieve and the results they deliver toward The Goal.
Aligning towards The Goal
Let me pause for a minute to elaborate on The Goal. If you’re not familiar with the book The Goal by Eliyahu Goldratt, I highly encourage you to pick up a copy. I won’t do it justice in this article. It’s a great book that’s typically assigned as required reading in most MBAs. It became foundational to the introduction of a concept called the theory of constraints, where Dr. Goldratt defines the importance of understanding the company goal and identifying the system bottlenecks which have an impact on delivering toward that goal.
The Goal outlines how each company exists to generate profit, drive value, and make something meaningful. How do you achieve that goal? Contrary to common belief, it’s not by making your team work more hours or maximizing their capacity to the breaking point. It’s by identifying the bottlenecks which hold the team back and supporting the team to clear the path to deliver results.
What does this have to do with presenting to the board?
Well, a lot actually. Often, engineering leaders aren’t the best at measuring their team’s execution and understanding the metrics that represent the state of the team. I’ve watched sales and marketing teams pour over data and metrics to represent their team’s effort, execution, and efficiencies in their journey towards The Goal. It’s amazing to see how the data allows those leaders to pinpoint where they need to put their efforts, what is working, and what is not working well.
Engineering metrics matter
Now it’s our turn to do the same as engineering leaders. Take a look at your engineering operation and start to identify some measures that can help you see how the team is executing and what’s getting in their way. These metrics are an invaluable tool for your team and you can leverage them to allow for more insights to surface to your stakeholders and board members.
Engineering shouldn’t be an opaque box to anyone. I know it may seem easier to avoid hard conversations with your team and your board about the challenges you’re facing but a supportive board can provide valuable feedback. Having the data can help you drive the conversation and articulate the engineering team challenges clearly.
Going back to presenting to the board as one team, no one leader should feel that they need to tell their story independently. It’s important to present alongside your peers and especially your product leader. There are two key sets of metrics that can help you make sure that your engineering and product teams are in lockstep, and that both organizations are working to deliver value for the company.
In my recent talk, ‘Empower your team to do their best work’, I outlined these two key categories: engineering metrics and product metrics.
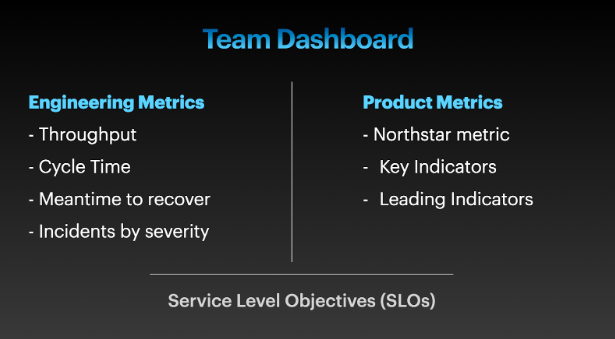
Engineering metrics help you measure the efficiency of your execution. Think of them as the gauges that tell you whether your gears are tuned and turning in the most efficient and optimal way. If there’s a bottleneck in the system, these metrics can alert you to focus on what is impacting your team. Product metrics, on the other hand, are about measuring direction and whether the team is building the right things.
Together, they help you make sure the motion (measured by team execution) is going in the right direction (measured by the product metrics).
Like a map, these two sets of metrics can help you present more effectively to the board. You can speak to the work the team is doing, where the product is heading, and how this all ties to the collective narrative of the executive team, delivering results for the business and heading towards The Goal.

Photo credit: Tamas Tuzes-Katai
In addition to current engineering work, your board is likely to want to know about your hiring and growth plans for the organization. Demonstrating a vision for how you intend to grow and build the team is important. During a growth stage, it’s always good to have a slide that shows how the organization is laid out and the key roles you’re looking to add. Be thoughtful with your growth plans. Growing the team needs to clearly outline the results you expect to deliver and how you intend to continue to make the team efficient and effective.
Let’s take an example…
Now you have your dashboard and you’re able to measure key performance indicators of your team’s execution and direction. Your presentation to the board could look something like this. (This is a fictional example based on real past events.)
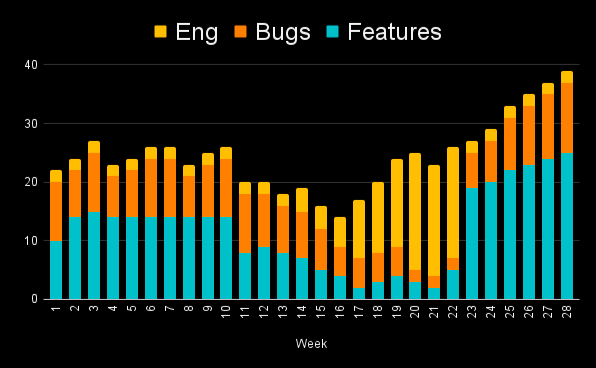
This quarter, the team identified that our throughput has been impacted by failing tests. Our data shows that the test failure rate is high. Our regression count is higher than usual because we’ve been dismissing these failures to get changes out to production.
Based on this data, which clearly shows how this is impacting the team’s execution, we are prioritizing work to improve our CI and increase our confidence in our tests. With this effort underway during the month of Feb, you can see the increase in our engineering priorities reflecting the investment in this engineering initiative.
We have been able to make great progress and the data shows that we are back to delivering at our consistent week-to-week rate. Not only that but subsequent weeks are showing a clear uptick in our throughput. This investment has led to better tests and more accurate measures of the code quality in production. It’s worth noting that while this impacted our ratio to focus on chores over features during those weeks, we are seeing a healthy uptick in our feature capacity and the team is able to build and ship the product at a much higher and healthier rate.
In short, our engineering investment has resulted in unlocking more capacity to deliver new features and product priorities.
Similarly, you could use data to show how the team’s product work is measured through product telemetry which can then be linked up to the business drivers and revenue that the company is now able to generate. I say this often: it is much better for a team to build two key features that have business impact than to build ten features that add more complexity in the codebase and product, and deliver little or no value to the customers.
Notice how both these narratives are based on data, and focus on the empowerment of the team and a drive for results. Do you see how this differs from a narrative where the engineering leader is unable to clearly assess and articulate what is getting in the team’s way to ship product features, or worse, why they’re shipping features, working hard but the business isn’t seeing any additional value?
In many cases, that same leader is then faced with the ask to drive the team to ship more, and work harder and more hours. Sadly, this is the result when the board lacks visibility over what’s impacting the team, what the team is building, and what’s driving value for the customers.
In summary
Presenting to the board is a great opportunity to refine your focus as an engineering leader. You don’t need to go through it alone; a healthy executive team acts as one team with a unified goal and a collective narrative. Your product partner is also your buddy on this journey. You’re both working toward the same goal: helping your team drive product value by improving your execution and direction.
Remember that data is your friend. Establish a good understanding of how your team works and represent that through different key metrics. You don’t need 30 data points; you only need a few key indicators that can help you debug what is getting in your team’s way so you can truly empower them to resolve these issues and focus on delivering your product. Good luck!