You have 1 article left to read this month before you need to register a free LeadDev.com account.
A framework for presenting engineering results to the board.
In the intricate ecosystem of an enterprise, engineering leaders must navigate a world filled with code merges, system optimizations, and bugs. However, their greatest challenge often isn’t within these technical realms, but in communicating their team’s contributions and challenges to a CEO who might not be well-versed in engineering.
If you want to start using these free slides for your engineering team right away, you can get them here.
Different departments communicate their worth and progress in vastly different terms. Marketing may be focused on lead generation, sales on its closing rates, or HR on recruitment targets. Engineering, though equally essential, can often seem like an enigma to those outside it.
As engineering leaders, it is your job to bridge this gap and clearly convey their domain’s complexities to resonate with top-tier management.
What happens when business executives understand engineering?
1. The entire company recognizes engineering’s value to the business
When engineering’s contributions are clearly articulated, it’s easier for executives across the company to view the team not as a mere operational necessity or cost center, but as a strategic powerhouse driving innovation.
2. Leaders from different departments can give thoughtful feedback
A well-informed leadership team won’t just question why engineering isn’t delivering “faster.” Instead, they will engage in constructive conversations about optimizing processes, improving workflows, and removing bottlenecks.
3. The entire business appreciates engineering’s resource requests
When decisions are data-driven, it becomes less about “asking for more” and more about showcasing the tangible benefits – be it in innovation speed, quality, or business alignment – of allocating additional resources or budget.
Decoding the metrics that will matter to the boardroom
A CEO essentially wants clarity on two things: the team’s efficiency and its alignment with overarching business objectives. Thankfully, there are simple, established metrics for these that resonate with executives.
Quality and Efficiency Metrics
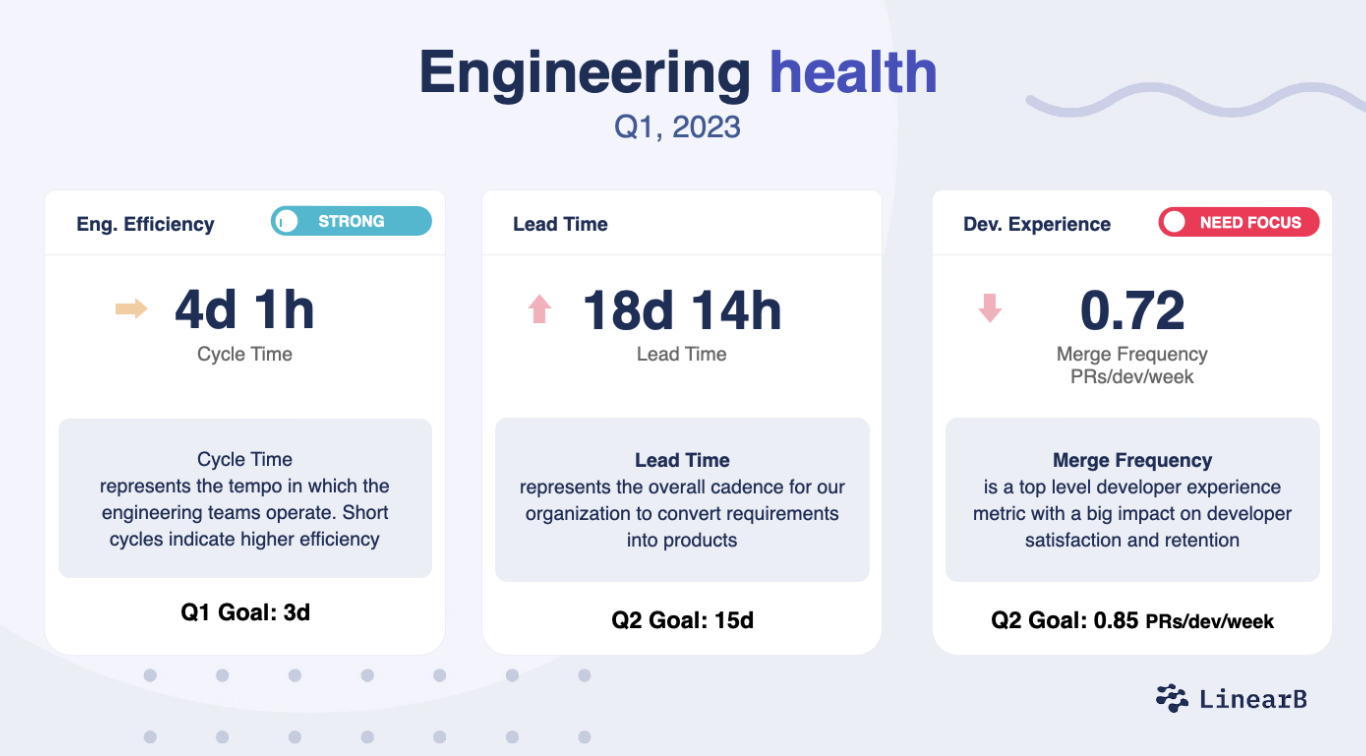
Cycle Time: This metric offers insight into the team’s workflow efficiency, measuring the time taken from the initiation to the completion of a task.
Lead Time: One of the core DORA metrics, this is a holistic measure encompassing the time from a customer’s request to the final product delivery, indicating both the team’s efficiency and responsiveness.
Merge Frequency: An indicator of the team’s agility and the maturity of its development practices. Regular and smooth integrations signal a streamlined development process.
Business Alignment Metrics
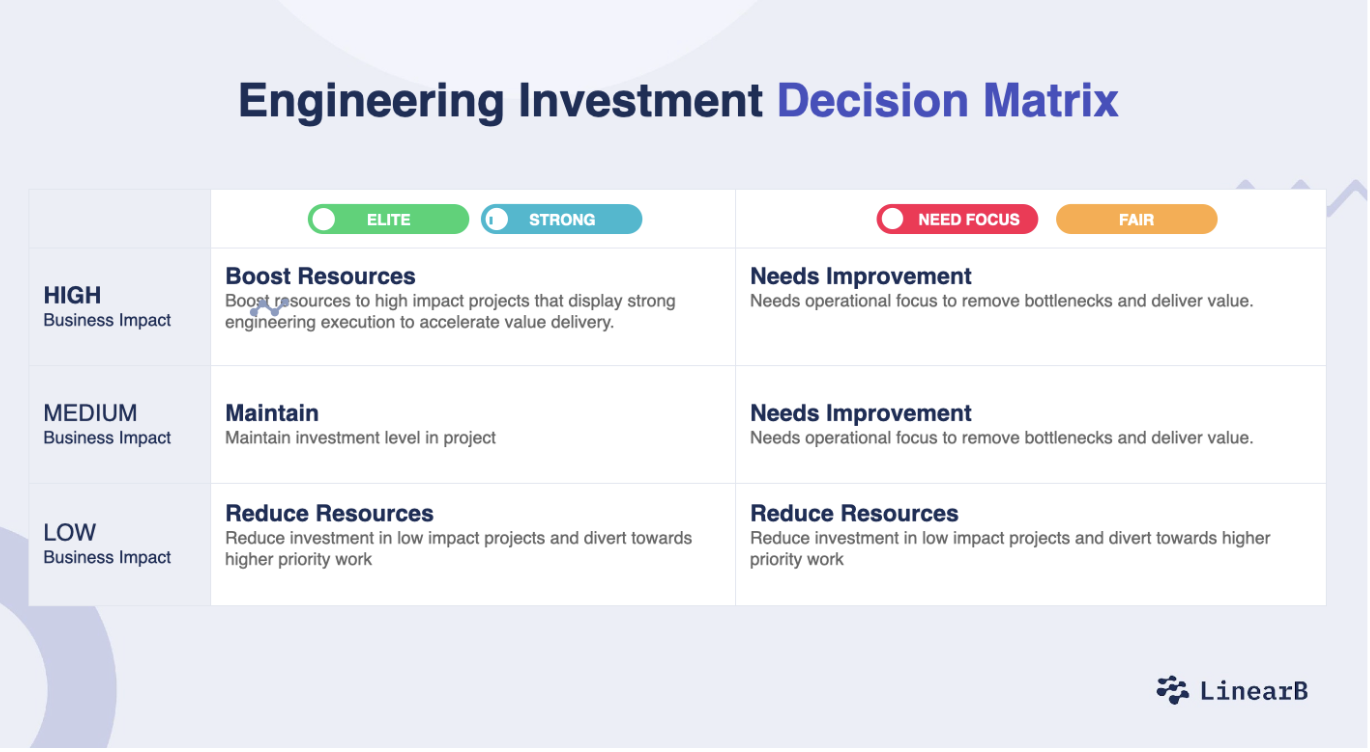
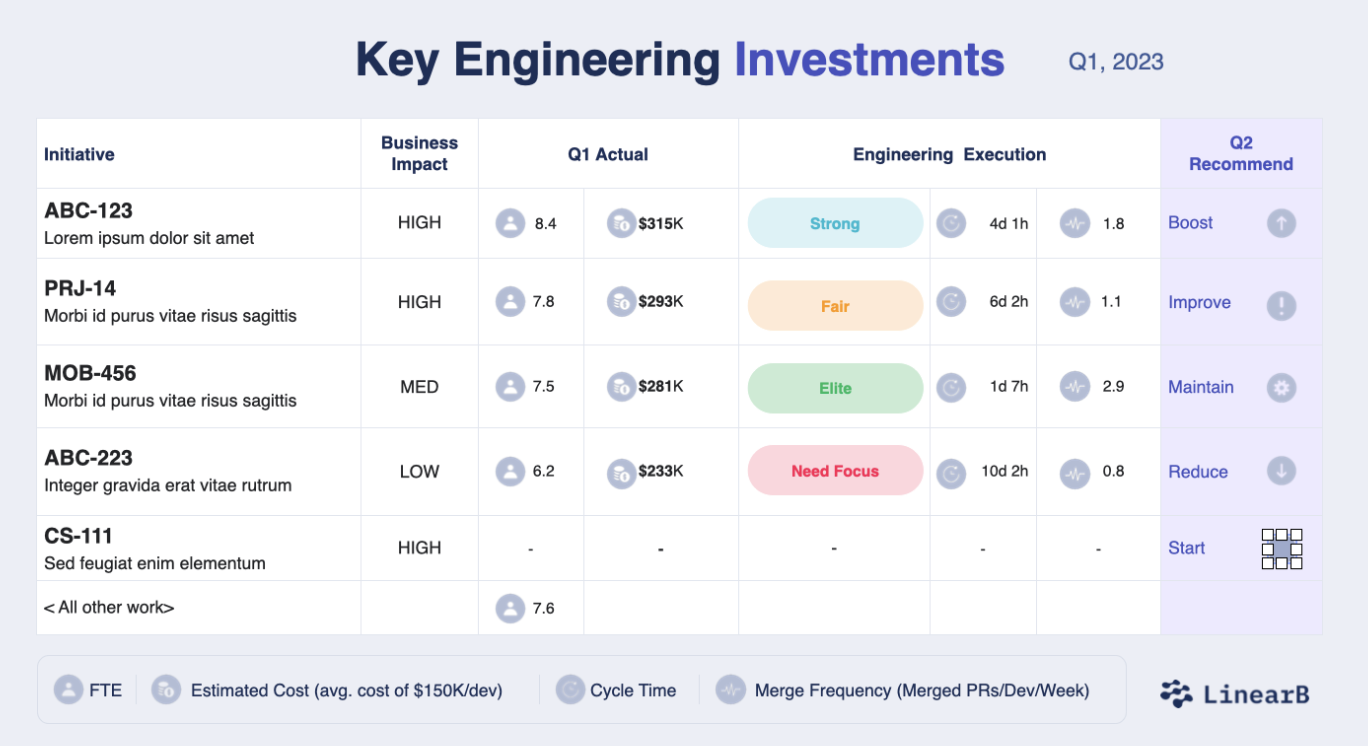
Business Impact: A simple yet effective way to categorize tasks. Does a project have a high, medium, or low potential to drive business outcomes? This helps prioritize resource allocation.
Full-time Equivalent (FTE): By equating tasks and projects to the output expected from a full-time employee, this metric offers a standardized measure of work, making it easier to gauge effort versus output.
Estimated Cost: Translating effort and resources into monetary terms not only makes costs transparent but also aids in understanding the ROI of different projects.
Four Slides that bridge the gap between engineering and the business
1. Team Health Snapshot

Begin with a macro view. Display metrics that reveal the team’s overall health. Are you on par, lagging, or surpassing industry benchmarks? Are metrics trending positively since the last presentation? Setting a clear goal and showcasing the roadmap towards it instills confidence. When presenting this information, make sure to include any quarterly goals you’ve set and how your teams’ performance measures up.
2. Strategic Resource Allocation

Dive into the strategy. Which projects are consuming the most resources? Are they the ones with the highest business impact? This slide should offer a clear view of the alignment between effort and business value.
3. In-Depth Investment Overview

Go micro. Highlight specific projects, revealing exact investment levels, potential business impacts, and performance scores. This granularity ensures transparency and can be a stepping stone for deeper discussions on resource reallocation or strategic shifts.
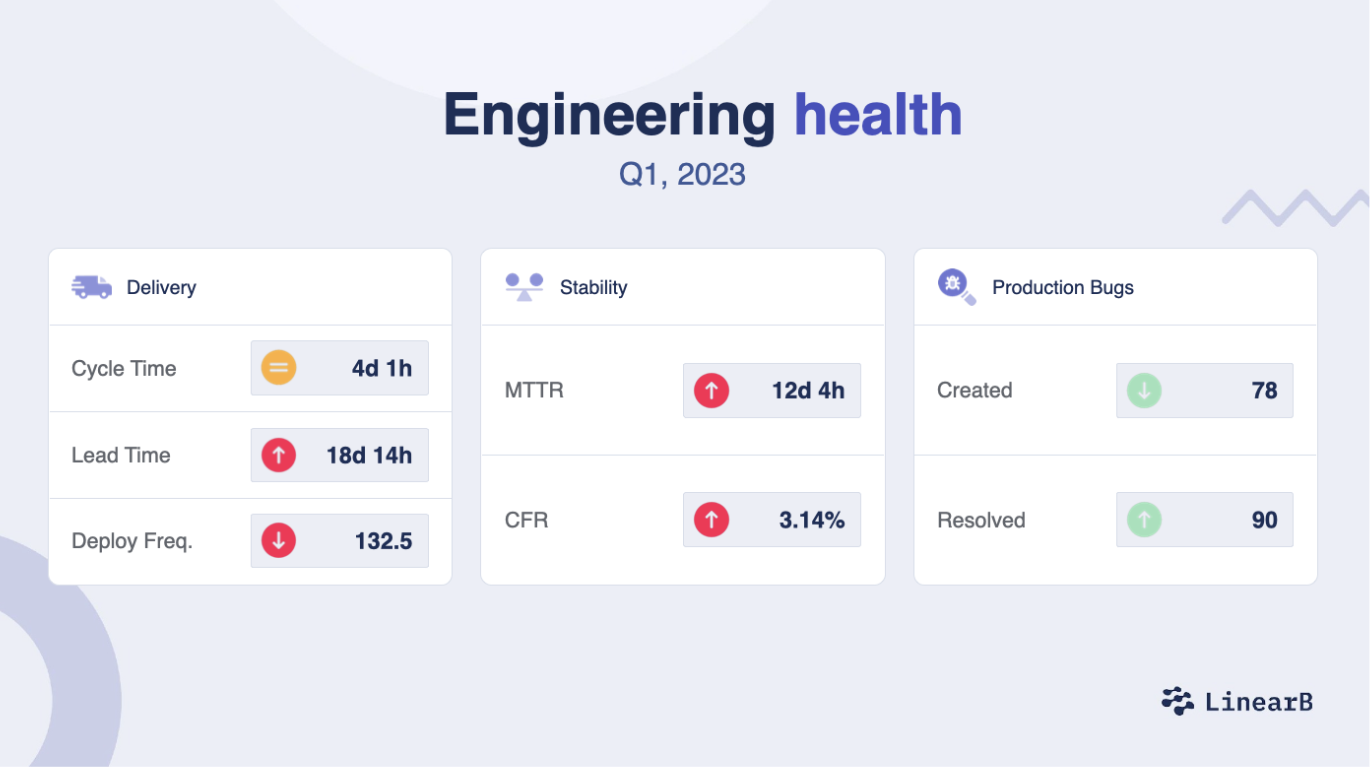
4. Operational Metrics Overview

End with a holistic view of operational health. This isn’t just about efficiency but also stability. Highlight metrics that shed light on system robustness, the frequency of bugs, and the team’s agility in addressing them.
Other metrics that bridge the gap between CTOs and CEOs
If your CEO is now hungry for more information. Other slides and metrics they’ll be interested in seeing regularly might include:
- Segment investments by new value, feature enhancements, developer experience, keeping the lights on, and tech debt.
- Track and showcase variations in lead time, helping predict future delivery timelines.
- Maintain a transparent log of change failures and ensure there’s clarity on both challenges and resolutions.
- Periodically analyze and present feedback on developer experience, ensuring that the backbone of your engineering – your team – is happy and motivated.
Turn your board into your biggest engineering evangelist
Engineering involves a complex web of challenges and intricacies, and deserves a voice in the boardroom that does it justice. Tech leaders are responsible for demystifying this world, ensuring it’s not just understood, but also valued. With the right DORA metrics, a well-crafted presentation, and a dash of storytelling, this bridge can be built.
To empower your boardroom communications, consider leveraging tools and templates. Our complimentary slide deck is an excellent starting point. Plus, integrating your data with tools like LinearB can bring in automation and precision.


